Monitoring internet speed with a Raspberry Pi
While cleaning out some old cartons last weekend, I found my old Raspberry Pi Model B+. It is the first iteration of the Pi. It has a 700MHz ARM CPU and 512MB of RAM. It uses a micro-SD card for non-volatile storage. So as you can see, it is quite a capable little computer, and you can power it off a standard 5V USB charger, which means you can run it all the time without worrying about power consumption.
I decided to track my home internet speed to see if my ISP is ripping me off 😉. Here’s how I did it.
Measuring speed on Raspberry Pi
Speedtest.net has an official CLI client that you can install directly using apt. It selects the best server automatically and reports the download and upload speed, along with the latency of your connection.
$ speedtest-cli
Retrieving speedtest.net configuration...
Testing from ACT Fibernet (X.X.X.X)...
Retrieving speedtest.net server list...
Selecting best server based on ping...
Hosted by North East Dataa Network Pvt Ltd (Bangalore) [0.10 km]: 9.601 ms
Testing download speed................................................................................
Download: 83.85 Mbit/s
Testing upload speed................................................................................................
Upload: 60.37 Mbit/s
There is an option to get this info in json format, which is easier to parse.
{
  "download": 30421342.381950885,
  "upload": 19739920.106307168,
  "ping": 30.315,
  "server": {
    "url": "http://speed.telexair.in:8080/speedtest/upload.php",
    "lat": "12.9716",
    "lon": "77.5946",
    "name": "Bangalore",
    "country": "India",
    "cc": "IN",
    "sponsor": "TelexAir Telecom Pvt Ltd",
    "id": "14493",
    "host": "speed.telexair.in:8080",
    "d": 0.10306914928173351,
    "latency": 30.315
  },
  "timestamp": "2020-09-18T16:47:59.425361Z",
  "bytes_sent": 24870912,
  "bytes_received": 38423553,
  "share": null,
  "client": {
    "ip": "X.X.X.X",
    "lat": "12.9719",
    "lon": "77.5937",
    "isp": "ACT Fibernet",
    "isprating": "3.7",
    "rating": "0",
    "": "0",
    "ispulavg": "0",
    "loggedin": "0",
    "country": "IN"
  }
}
So I wrote a simple python script to capture this output.
import subprocess
import json

speed_test = subprocess.Popen(['speedtest-cli', '--json'],
    stdout=subprocess.PIPE, stderr=subprocess.STDOUT)
out, err = speed_test.communicate()
speed_dict = json.loads(out)

print('download=' + str(int(speed_dict['download'])))
print('upload=' + str(int(speed_dict['upload'])))
print('time=' + str(int(now)))
Store measurments in a Firestore DB
A bit of code will push this to a Firestore DB. Google lets you use a Firestore DB for free if you stay within a reasonable number of operations per day.
from google.cloud import firestore

now = time.time()
db = firestore.Client()
doc_ref = db.collection('speedtests').document(str(int(now)))
doc_ref.set({
    'download': str(int(speed_dict['download'])),
    'upload': str(int(speed_dict['upload'])),
    'ping': str(int(speed_dict['ping'])),
    'server_url': str(speed_dict['server']['url']),
    'server_lat': str(speed_dict['server']['lat']),
    'server_lon': str(speed_dict['server']['lon']),
    'server_name': str(speed_dict['server']['name']),
    'server_country': str(speed_dict['server']['country']),
    'server_cc': str(speed_dict['server']['cc']),
    'server_sponsor': str(speed_dict['server']['sponsor']),
    'server_id': str(speed_dict['server']['id']),
    'server_host': str(speed_dict['server']['host']),
    'server_distance': str(speed_dict['server']['d']),
    'server_latency': str(speed_dict['server']['latency']),
    'bytes_sent': str(int(speed_dict['bytes_sent'])),
    'bytes_received': str(int(speed_dict['bytes_received'])),
    'client_ip': str(speed_dict['client']['ip']),
    'client_lat': str(speed_dict['client']['lat']),
    'client_lon': str(speed_dict['client']['lon']),
    'client_isp': str(speed_dict['client']['isp']),
    'client_isp_rating': str(speed_dict['client']['isprating']),
    'client_rating': str(speed_dict['client']['rating']),
    'client_ispdlavg': str(speed_dict['client']['ispdlavg']),
    'client_ispulavg': str(speed_dict['client']['ispulavg']),
    'client_loggedin': str(speed_dict['client']['loggedin']),
    'client_country': str(speed_dict['client']['country']),
})
Take measurements every 30 minutes
Then I added this to crontab so it runs every 30 minutes.
GOOGLE_APPLICATION_CREDENTIALS="/home/pi/speed-monitor/speed-db-key.json"
*/30 * * * * python3 speed-monitor.py
Pulling records from Firestore to Google Sheets
I let this run for a bit over 24 hours, and got 52 readings. Next step was to write a small Google Apps Script to pull these records from Firestore and put them in rows in a Google Sheets worksheet.
function copyFromFirestore() {
  const firestore = FirestoreApp.getFirestore(email, key, projectId);
  const allDocuments = firestore.getDocuments("speedtests");
  Logger.log('num=' + allDocuments.length);
  for(i=0;i<allDocuments.length;i++) {
    var sheet = SpreadsheetApp.getActiveSheet();
    sheet.appendRow([allDocuments[i].createTime, allDocuments[i].fields.download.stringValue, allDocuments[i].fields.upload.stringValue, allDocuments[i].fields.ping.stringValue]);
  }
}
Then it’s simple to chart the speeds and latency over the roughly 24-hour period.
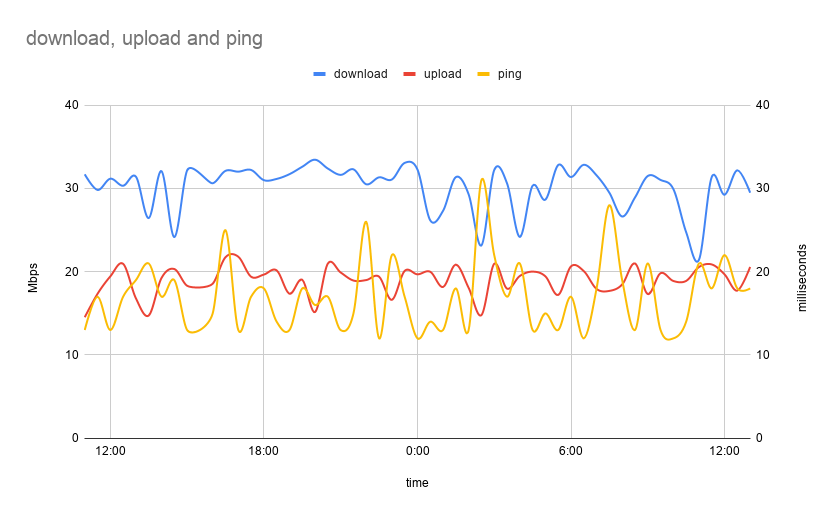
Problem in the setup
This chart shows that my download speed varies between 20 to 35Mbps, and the upload varies between 15 to 20Mbps. This is significantly lower than the 100Mbps symmetric I pay for. If you go back to the first test result I showed in this post, which I ran from my laptop, it shows 83Mbps download and 60Mbps upload. So why this discrepancy?
I suspect this is where my old Pi is showing its age. Even though it is connected to my router using a 100Mbps ethernet cable, the hardware is simply not powerful enough to fully saturate the connection. So I will not be running this setup anymore. Maybe one day I’ll get a newer model and run this for a longer duration. That would hopefully reveal some interesting patterns.
Another concern of mine is the amount of data transfered. Each run of the test consumes around 60MB of data. Running it every half hour for a month would use up ~85GB. That is close to 17% of my plan’s monthly quota. That would probably push me over the limit and cause the connection to slow down to something unusable like 1Mbps.